Study Design, Area, and Period
This cross-sectional study was carried out from February to March 2018 at the Modjo dry port, which is Ethiopia’s first dry port expansion initiated at the end of 2009 to alleviate congestion at Djibouti port. Located in central Ethiopia, 38 miles southeast of Addis Ababa, the port plays a critical role in managing 95% of Ethiopia’s trade and serves as a significant bottleneck in the Ethiopian-Djibouti trade route [23].
Populations
The source population consisted of all cross-country truck drivers traveling between the Modjo dry port in Ethiopia and Djibouti international port. From this group, truck drivers were systematically chosen to form the study population.
Study Variables
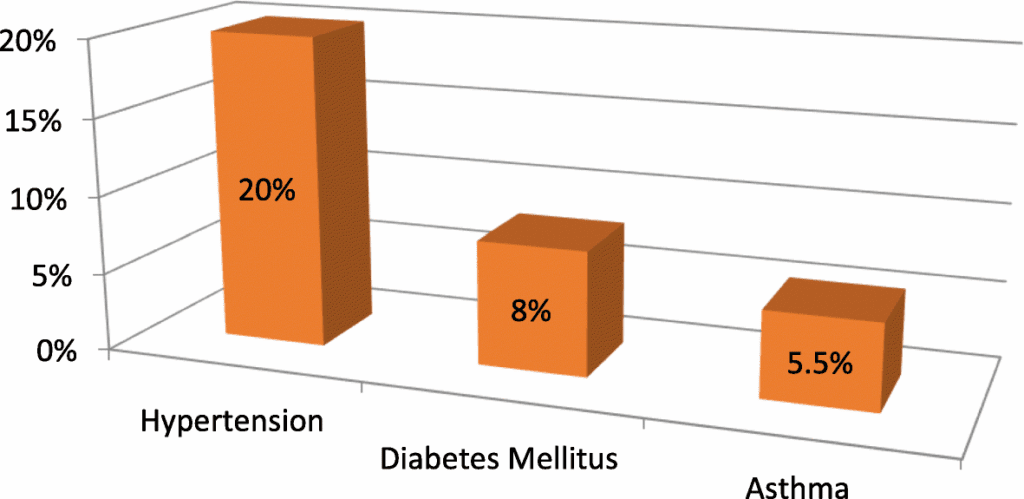
The primary dependent variable studied was chronic non-communicable diseases, defined as the presence of at least one of the following: Hypertension, Diabetes, or Asthma. Independent variables included sociodemographic factors such as age, education, monthly income, marital status, family size, and body mass index; behavioral factors including cigarette smoking, chat chewing, alcohol consumption, and physical activity; as well as occupational and psychosocial factors like daily driving hours, years of truck driving experience, rest breaks, and perceived job stress.
Sample Size Determination
The sample size was calculated using a single population proportion formula, assuming a prevalence of 50% for non-communicable diseases due to the lack of prior studies on this topic among Ethiopian truck drivers. A confidence level of 95% was used with a precision of 5%, along with a 10% increase for potential non-responses. This calculation resulted in a final sample size of 422.
Sampling Method
Participants were selected through systematic random sampling. Each truck driver anticipated to make a round trip from the Modjo dry port to Djibouti and back within 15 days was eligible. Based on reports from the Modjo Dry Port Authority, approximately 300 to 400 trucks arrive daily. To ensure sufficient sampling, the final sample size of 422 was divided by 15 days to target roughly 28 drivers each day. By dividing 300 trucks by 28, a skipping interval of 11 was established, allowing every eleventh driver from a random start to be included until the required sample size was met.
Operational Definitions
Prevalence refers to the proportion of participants with confirmed chronic non-communicable diseases who are on medication. A daily cigarette smoker is someone who smokes any number of cigarettes every day. An alcohol drinker consumes beer or its local varieties every day or every other day. A chat chewer engages in this activity at least once a week. Physically active individuals are those who engage in physical activities for at least 30 minutes on 3 or more days per week. Proper mealtime constraints include having breakfast between 7-9 am, lunch from 12 pm to 2 pm, and dinner from 6 pm to 8 pm. A rest break during driving is defined as a pause taken after driving for an hour or more, excluding meals.
Data Collection Instrument and Procedures
Data collection utilized an interviewer-administered questionnaire, formulated after reviewing relevant literature. This questionnaire covered socio-demographic, lifestyle, medical, occupational, ergonomic, and psychosocial factors (Additional file 1- Questionnaire). It was initially created in English, then translated into Amharic, followed by re-translation to maintain consistency. A pretest was conducted with 5% of the sample size in Akaki, a key truck parking area. Participants’ body mass index was measured using the standardized DHM-15A scale.
Data Processing and Analysis
Data collected were processed and analyzed using statistical software. Data entry was performed in EPI-data version 4.2.0.0, followed by analysis with SPSS version 20. The binary logistic regression model was executed, and variables with a p-value < 0.25 in bivariate analysis were included in multivariable analysis. In this final model, independent variables significantly associated with the outcome (p-value < 0.05) were identified. Multi-collinearity checks confirmed an acceptable variance inflation factor (VIF) of less than 2. The model's goodness-of-fit was affirmed by the Hosmer-Lemeshow test, with a p-value of 0.475, indicating a good fit for the data.


